packages = c('igraph', 'tidygraph',
             'ggraph', 'visNetwork',
             'lubridate', 'clock',
             'tidyverse', 'ggmap')
for(p in packages){
  if(!require(p, character.only = T)){
    install.packages(p)
  }
  library(p, character.only = T)
}
GAStech_nodes <- read_csv("data/GAStech_email_node.csv")
GAStech_edges <- read_csv("data/GAStech_email_edge-v2.csv")
# GAStech_edges$SentDate  = dmy(GAStech_edges$SentDate)
# GAStech_edges$Weekday = wday(GAStech_edges$SentDate,
#                              label = TRUE,
#                              abbr = FALSE)

GAStech_edges <- GAStech_edges %>%
  mutate(SentDate = dmy(SentDate)) %>%
  mutate(Weekday = wday(SentDate, label = TRUE, abbr = FALSE))
GAStech_graph <- tbl_graph(nodes = GAStech_nodes,
                           edges = GAStech_edges_aggregated,
                           directed = TRUE)
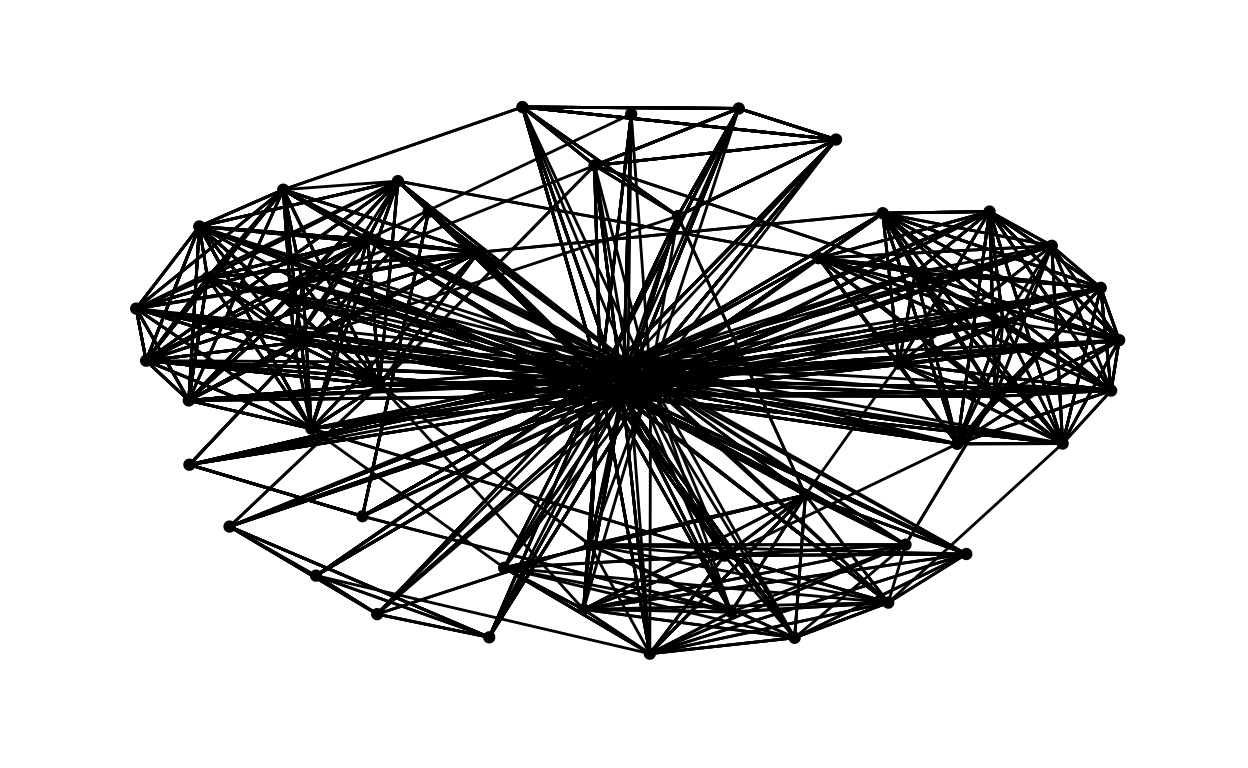
set.seed(1234)
ggraph(GAStech_graph, layout = "stress") +
  geom_edge_link() +
  geom_node_point() +
  theme_graph()
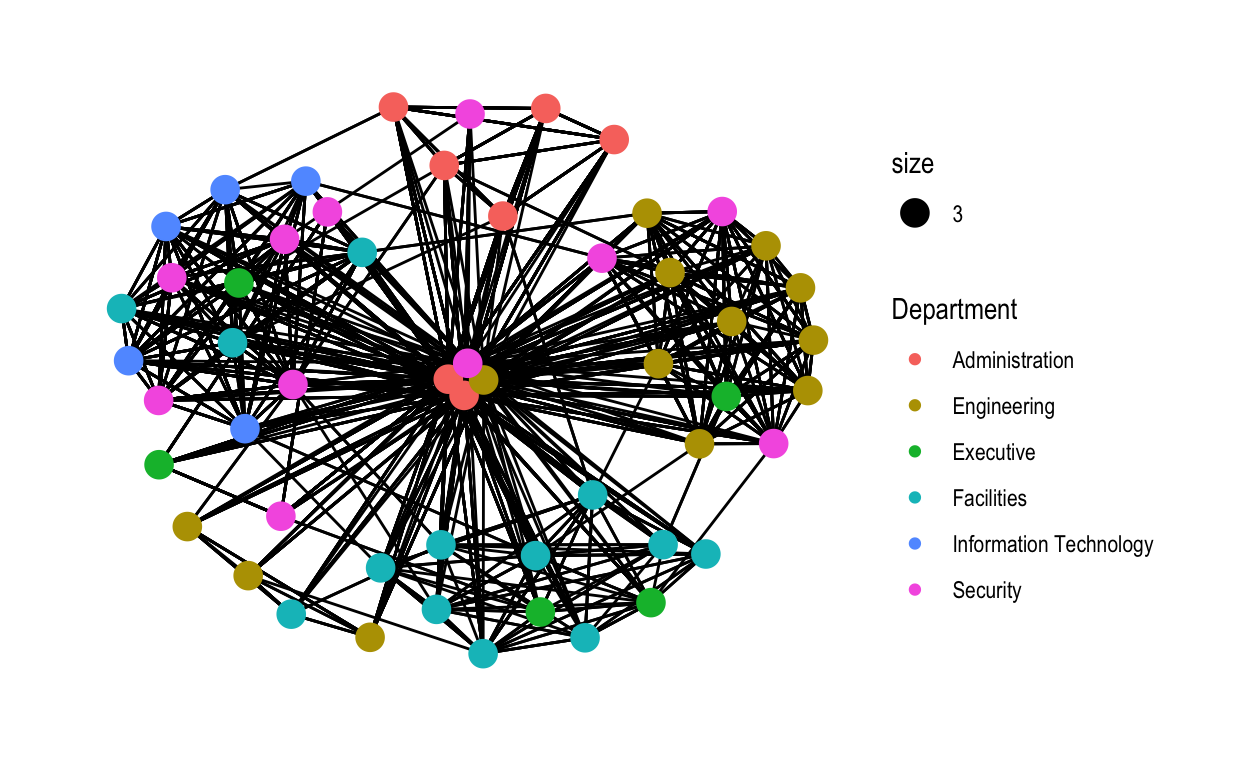
Modified Nodes
set.seed(1234)
ggraph(GAStech_graph, layout = "stress") +
  geom_edge_link() +
  geom_node_point(aes(colour = Department, size=3)) +
  theme_graph()
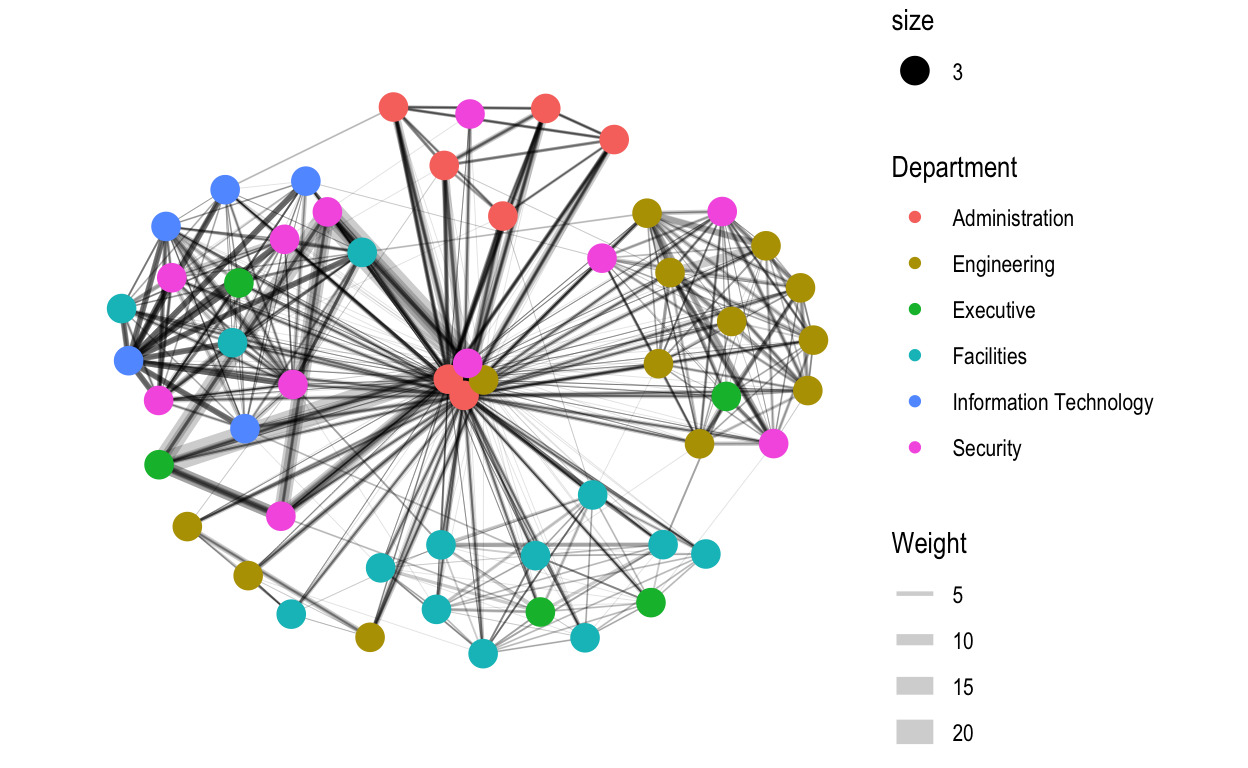
Modified Edges
set.seed(1234)
ggraph(GAStech_graph, layout = "stress") +
  geom_edge_link(aes(width=Weight), alpha=0.2) +
  scale_edge_width(range = c(0.1, 5)) +
  geom_node_point(aes(colour = Department, size=3)) +
  theme_graph()
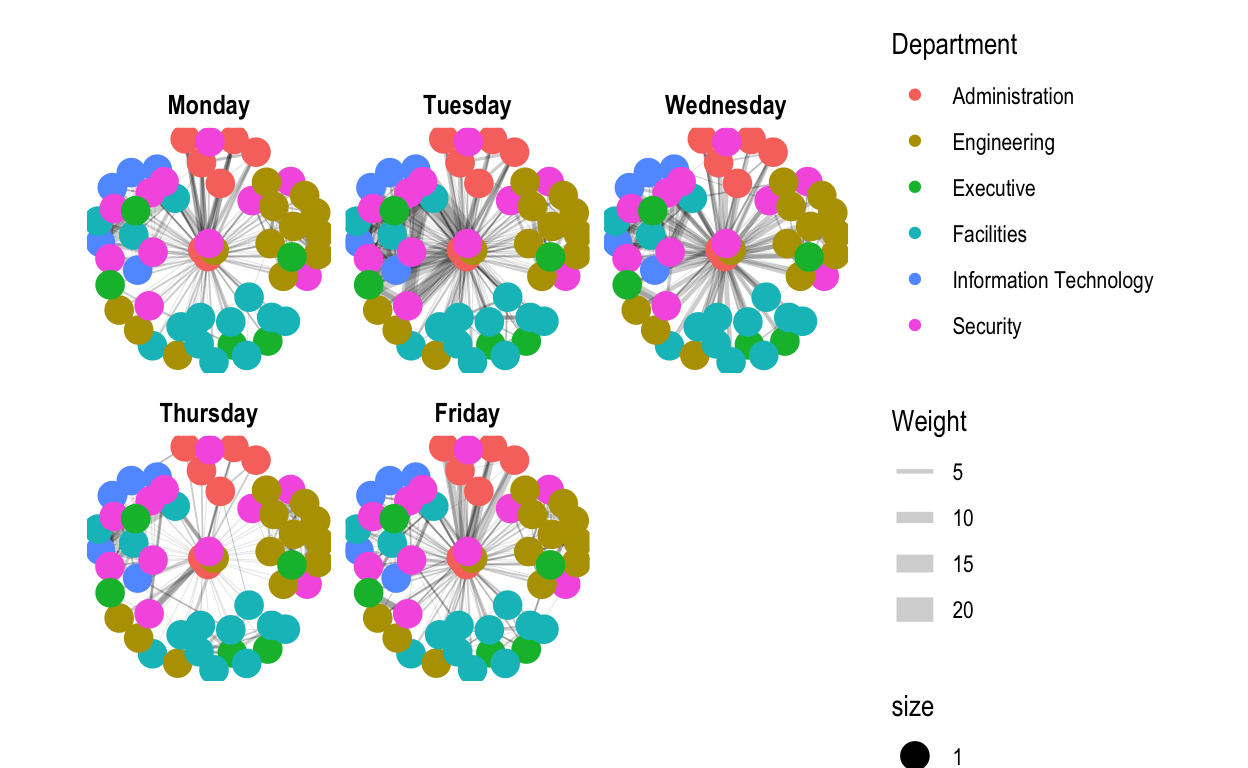
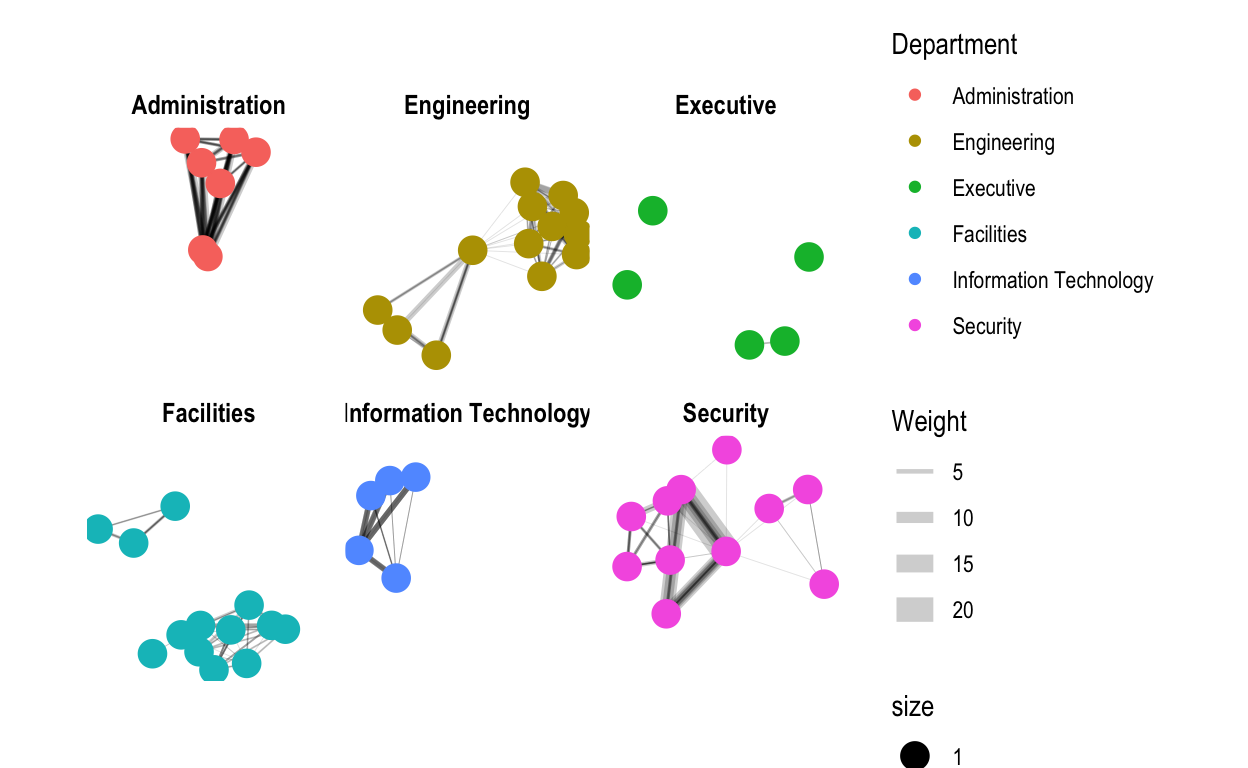
Working with facets
set.seed(1234)
ggraph(GAStech_graph, layout = "stress") +
  geom_edge_link(aes(width=Weight), alpha=0.2) +
  scale_edge_width(range = c(0.1, 5)) +
  geom_node_point(aes(colour = Department, size=1)) +
  theme_graph() +
  facet_edges(~Weekday)
set.seed(1234)
ggraph(GAStech_graph, layout = "stress") +
  geom_edge_link(aes(width=Weight), alpha=0.2) +
  scale_edge_width(range = c(0.1, 5)) +
  geom_node_point(aes(colour = Department, size=1)) +
  theme_graph() +
  facet_nodes(~Department)
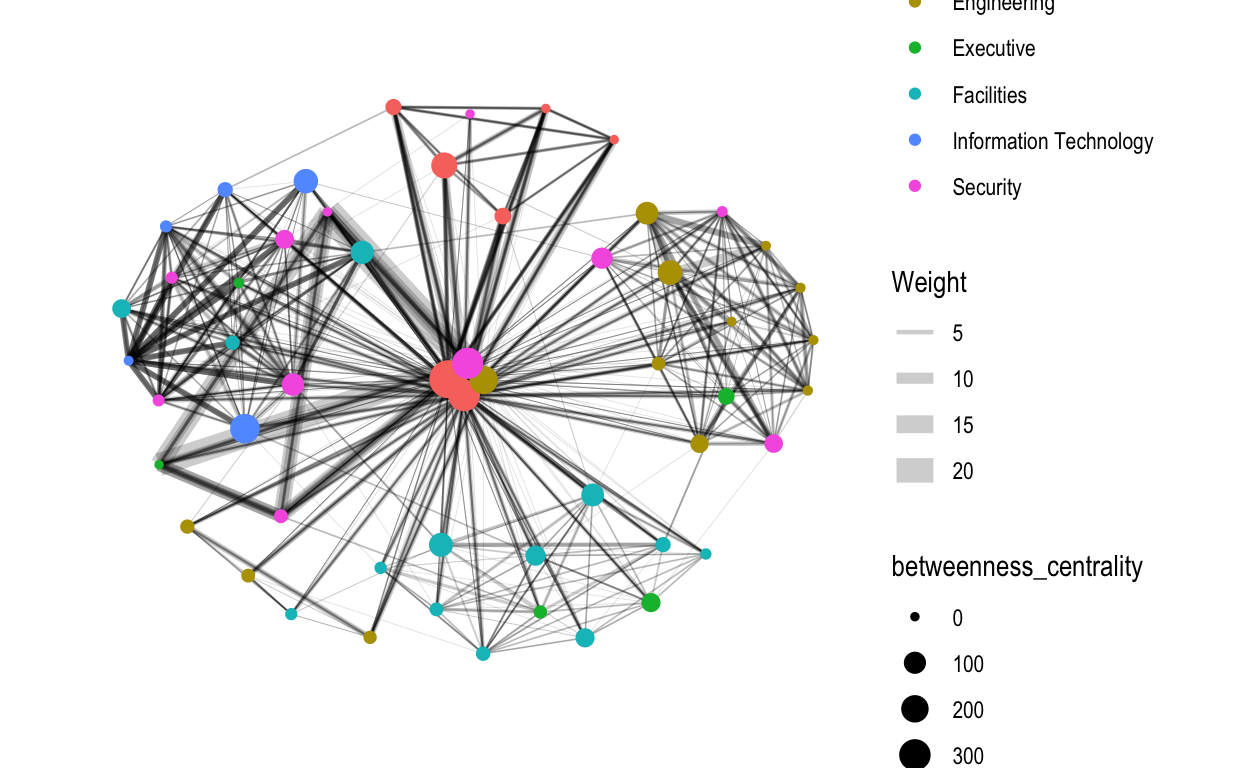
network graph with Centrality Metric
GAStech_graph %>%
  mutate(betweenness_centrality = centrality_betweenness()) %>%
  ggraph(layout = "stress") +
  geom_edge_link(aes(width=Weight), alpha=0.2) +
  scale_edge_width(range = c(0.1, 5)) +
  geom_node_point(aes(colour = Department, size=betweenness_centrality)) +
  theme_graph()
GAStech_edges_aggregated <- GAStech_edges %>%
  left_join(GAStech_nodes, by = c("sourceLabel" = "label")) %>%
  rename(from = id) %>%
  left_join(GAStech_nodes, by = c("targetLabel" = "label")) %>%
  rename(to = id) %>%
  filter(MainSubject == "Work related") %>%
  group_by(from, to) %>%
    summarise(weight = n()) %>%
  filter(from!=to) %>%
  filter(weight > 1) %>%
  ungroup()
visNetwork(GAStech_nodes,
           GAStech_edges_aggregated)
visNetwork(GAStech_nodes,
           GAStech_edges_aggregated) %>%
  visIgraphLayout(layout = "layout_with_fr")
GAStech_nodes <- GAStech_nodes %>%
  rename(group = Department)

visNetwork(GAStech_nodes,
           GAStech_edges_aggregated) %>%
  visIgraphLayout(layout = "layout_with_fr") %>%
  visLegend() %>%
  visLayout(randomSeed = 123)
visNetwork(GAStech_nodes,
           GAStech_edges_aggregated) %>%
  visIgraphLayout(layout = "layout_with_fr") %>%
  visEdges(arrows = "to",
           smooth = list(enabled = TRUE,
                         type = "curvedCW")) %>%
  visLegend() %>%
  visLayout(randomSeed = 123)